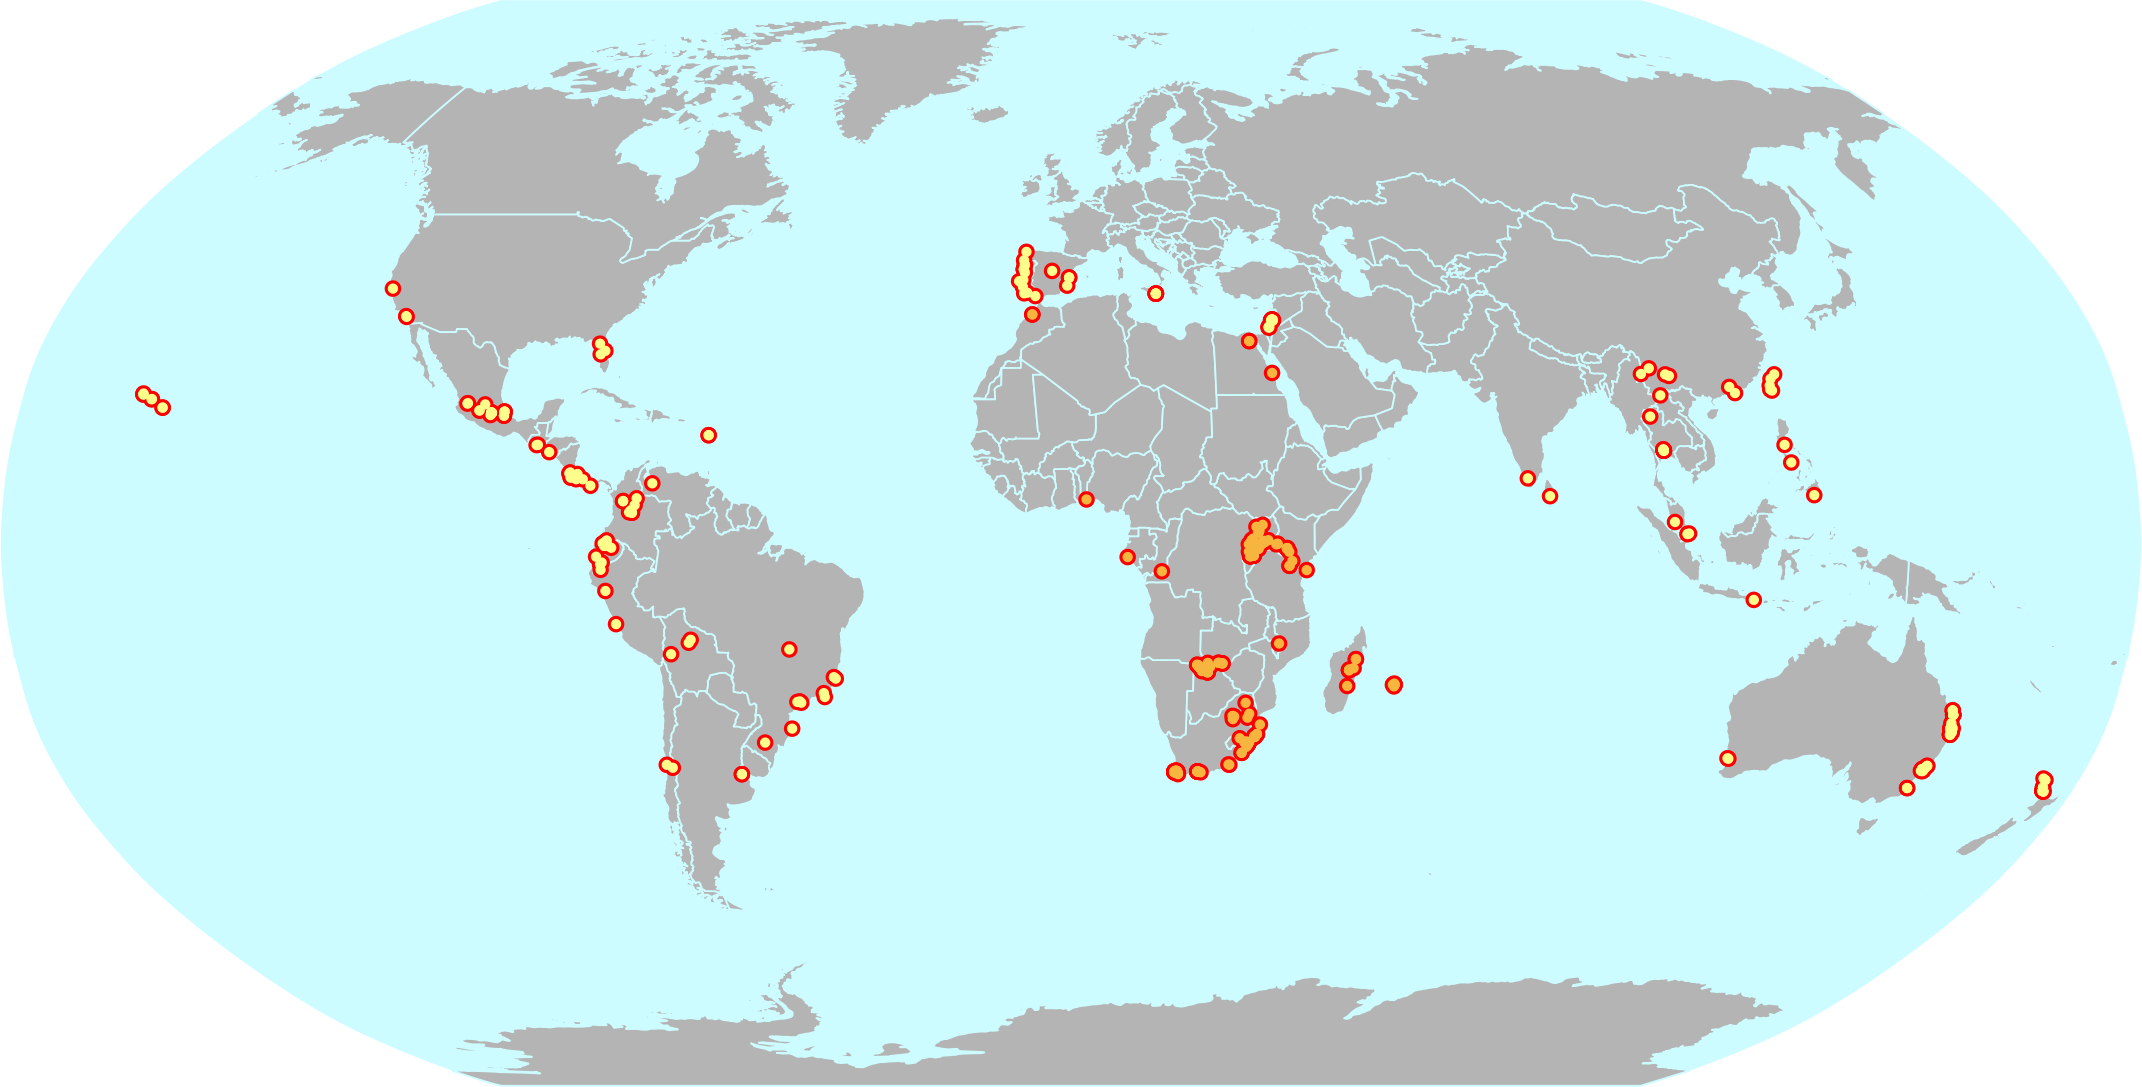
There is a daily challenge to produce a map. Here is my response.
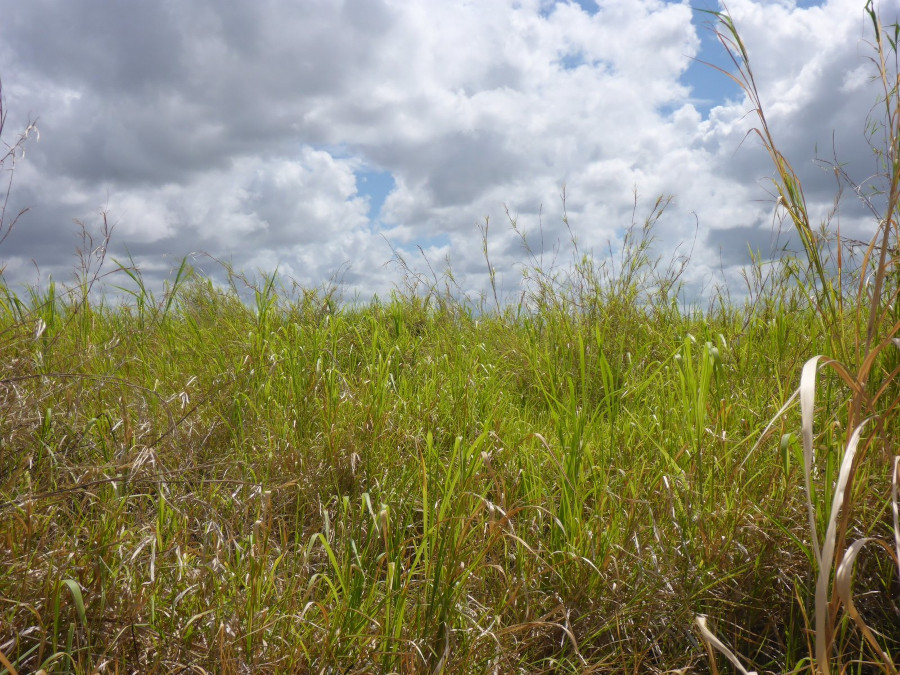
An example session of working with vegetation plot observations in R using the vegtable package and an open access dataset of over 300 observations collected from published references and field surveys.
A brief account of the experiences gained after a long review process of the package taxlist for its submission to rOpenSci. This journey resulted on new tools learned and new friends.
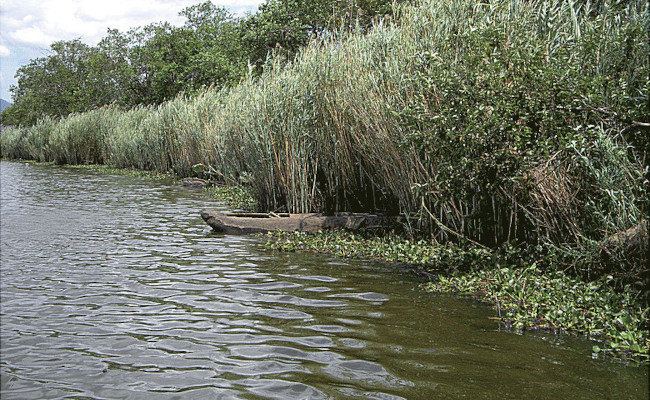
Our paper on the classification of East African wetland communities using the Braun-Blanquet approach made the cover of Phytocoenologia.